Spline#
lamatrix provides a Spline model which can be used to capture smoothly varying trends in time. B-Splines are useful because they are flexible, linear, and simple to fit. They are defined by the user by setting the widths of “knots”, which tunes the scale of the variability.
[1]:
import numpy as np
import matplotlib.pyplot as plt
x = np.arange(-10, 10, 0.01)


from lamatrix import Spline
[2]:
Spline(knots=np.arange(-4, 4), order=3).equation
[2]:
\[f(\mathbf{x}) = w_{0} N_{1, {3}}(\mathbf{x}) + w_{1} N_{2, {3}}(\mathbf{x}) + w_{2} N_{3, {3}}(\mathbf{x}) + w_{3} N_{4, {3}}(\mathbf{x})\]
[3]:
Spline(knots=np.arange(-4, 4), order=3).spline_equation
[3]:
\[f(\mathbf{x}) = \sum_{i=0}^{n-1} w_i N_{i,k}(\mathbf{x}) \]
\[N_{i,k}(\mathbf{x})= \frac{\mathbf{x} - t_i}{t_{i+k-1} - t_i} N_{i,k-1}(\mathbf{x}) + \frac{t_{i+k} - \mathbf{x}}{t_{i+k} - t_{i+1}} N_{i+1,k-1}(\mathbf{x})\]
\[N_{i,1}(\mathbf{x}) =
\begin{cases}
1 & \text{if } t_i \leq \mathbf{x} < t_{i+1} \\
0 & \text{otherwise} \\
\end{cases}
\]
\[t = [-4 , -3 , -2 , -1 , 0 , 1 , 2 , 3]\]
\[ k = 3 \]
[4]:
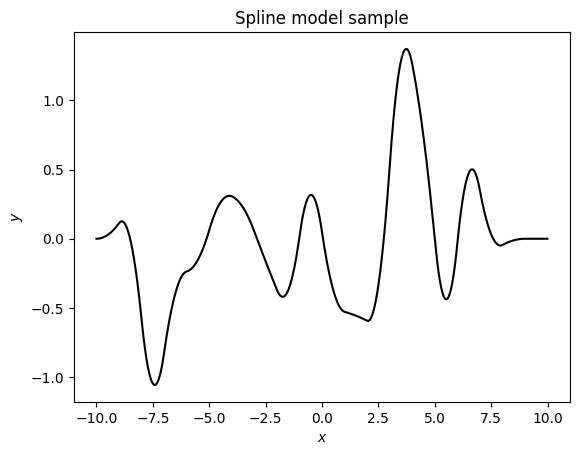
model = Spline('x', knots=np.arange(-10, 10), order=3)
w = np.random.normal(size=model.width)
sample = model.design_matrix(x=x).dot(w)
[5]:
fig, ax = plt.subplots()
ax.plot(x, sample, c='k')
ax.set(xlabel='$x$', ylabel='$y$', title='Spline model sample');